
Case Study • Project 03

Mineral Tiles: from 12x to 29x return on ad spend.
I took over Meta advertising for a US online tile retailer and rebuilt how its budget was spent. More than four times the spend, over eleven times the revenue, and every purchase costing less.
Meta Ads
Campaign Strategy
Creative Testing
Scaling

Meta Ads Manager · Mineral Tiles
Since takeover · Mar 2025 – Sep 2026
Purchase ROAS
28.8x
▲ 2.4× the previous 12.1x
Before
12.1x
After
28.8x
Revenue from ads
$1.56M
▲ 11.6× was $134K
Purchases
6,331
▲ 8× was 796
Cost per purchase
$8.55
▼ 39% was $13.91
Ad spend
$54.1K
4.9× was $11.1K

The Client
A US tile specialist with a big catalogue.
Mineral Tiles sells ceramic, porcelain, glass, stone and mosaic tiles online to homeowners, designers and contractors across the United States, for kitchens, bathrooms, floors and pools.
They were already advertising on Facebook and Instagram. The question was whether the same budget, and more of it, could work harder.
Before & After
The same account, a very different return.
Previous campaigns compared with the campaigns I’ve run since taking over in March 2025.
Before
Since takeover
Change
Purchase ROAS
12.1x
28.8x
▲ 138%
Revenue from ads
$133,966
$1,560,626
▲ 11.6×
Purchases
796
6,331
▲ 8×
Cost per purchase
$13.91
$8.55
▼ 39%
Average order value
$168
$247
▲ 46%
Ad spend
$11,072
$54,121
4.9×
Figures from Meta Ads Manager (purchases and purchase conversion value). “Before” covers the account’s previous campaigns from August 2023; “since takeover” runs 11 March 2025 to 21 September 2026.
What I Changed
Fewer guesses, more of what works.
01 · Structure
A cleaner account
The account had run a mix of traffic, Advantage+, catalogue and one-off campaigns. I rebuilt it around purchase-focused prospecting campaigns using Advantage campaign budget.
02 · Scaling
Back the winner
When one prospecting campaign proved itself, it got the budget. Campaign 5 ended up carrying 83% of spend while returning 31x.
03 · Testing
Keep testing on the side
New creatives, a pool-focused audience and retargeting were tested in their own small campaigns, so experiments never put the main campaign at risk.
04 · Moments
Make the most of peaks
A dedicated Black Friday promotion ran for the sale week and returned 22.6x.
Campaign Breakdown
Where the return came from.
Purchase ROAS for each campaign since takeover, against the previous 12.1x average.
Previous average · 12.1x
31.0x
Campaign 5 · Prospecting
25.5x
New creatives test
22.6x
Black Friday promo
18.6x
Campaign 1 · Prospecting
16.2x
Campaign 4 · Prospecting
9.6x
Pool audience test
Campaign
Spend
Purchases
Revenue
ROAS
Cost / purchase
Campaign 5 · Prospecting
$45,152
5,582
$1,400,796
31.0x
$8.09
Campaign 1 · Prospecting
$4,757
440
$88,384
18.6x
$10.81
Campaign 4 · Prospecting
$2,542
199
$41,286
16.2x
$12.77
New creatives test
$568
38
$14,501
25.5x
$14.95
Black Friday promo
$564
41
$12,749
22.6x
$13.76
Pool audience test
$301
28
$2,890
9.6x
$10.76
Account total*
$54,121
6,331
$1,560,626
28.8x
$8.55
*Includes two small tests not listed above ($237 combined spend).
Outcome
Spending more, and getting more back for every dollar.
Scaling usually costs efficiency: the more you spend, the harder each extra sale is to win. Here the opposite happened. Spend grew almost five times, and the return on every dollar still more than doubled.
Each purchase costs 39% less than before, orders are larger, and the ads have driven over $1.5 million in revenue since March 2025.
Every $1 spent on ads now returns about $29.
Next Project
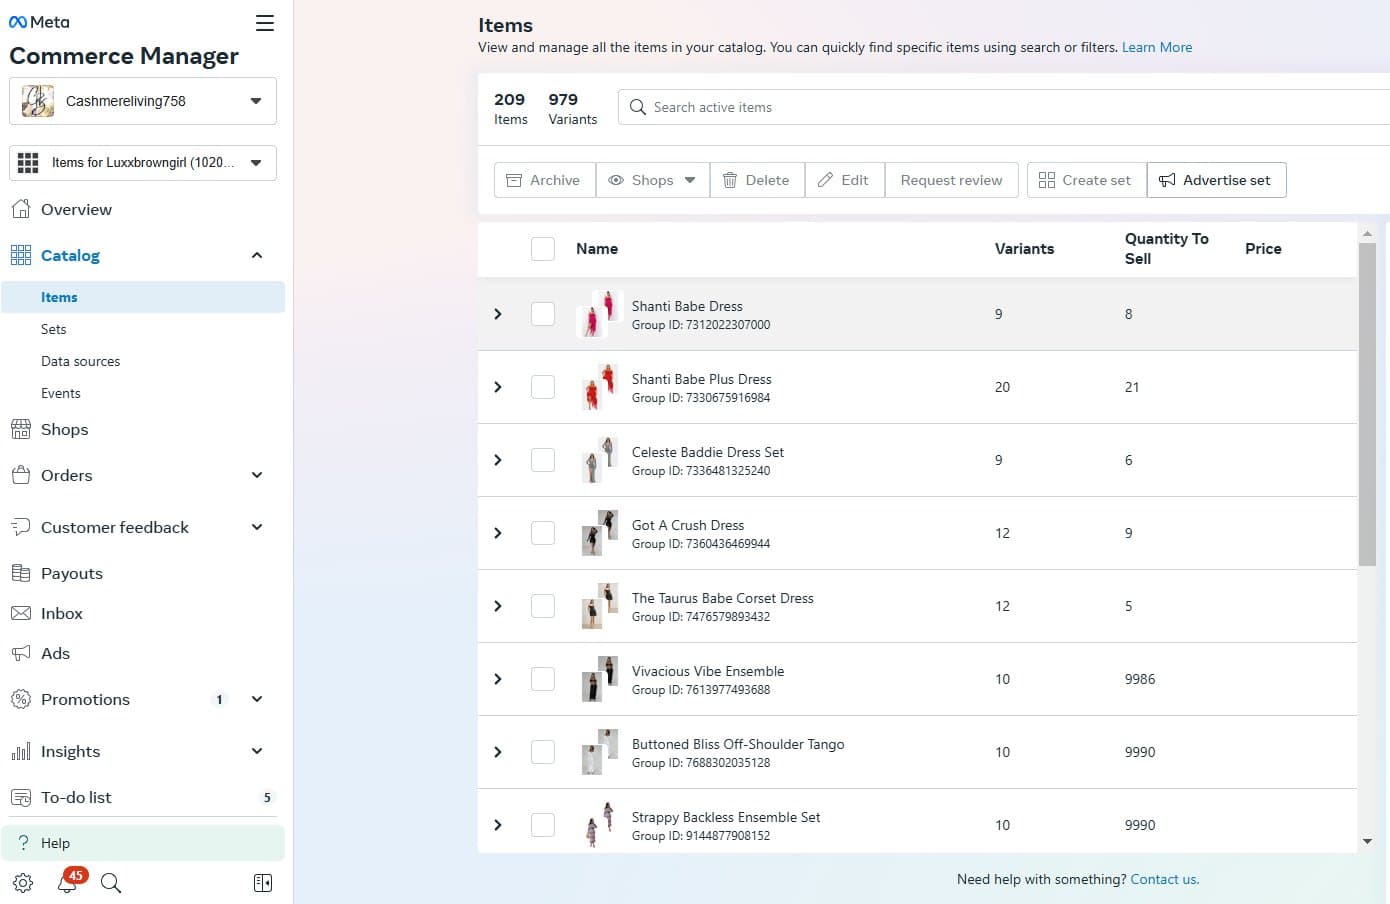
Luxx Brown Girl: a Meta Business setup built to sell on Facebook and Instagram.
Your Ads
Want your ad budget to work harder?
I plan, run and scale Meta campaigns around purchases and revenue, not clicks.